Introduction
In my article on Understanding Community Notes, I describe the basic Matrix Factorization algorithm used to identify notes that are helpful despite user polarization. In this article, I introduce a way to break this algorithm and describe an variation of the algorithm that uses 2-factor Matrix factorization.
Breaking the Algorithm
The algorithm uses Matrix Factorization to find a latent factor that best explains the variation among users’ votes. It assumes that this latent factor corresponds to some sort of polarization within the community. But what if the latent factor is due to diversity but not polarization? What if the factor that best explains variation in users’ votes corresponds to, for example, how informed or educated that user is? For example, suppose in some expert advice forum the regression for a post looks like this.
       Vote
        +1   ✕ ✕ ✕ ✕
         |    ↗
         |  ↗
-1 ______|↗______ +1  User Expertise
        ↗|
      ↗  |
    ↗    |
  ✕ ✕   -1
Unfortunately, the intercept is zero, and so it will get a low “helpfulness” score.
So the algorithm will favor posts that get upvoted regardless of user expertise. This is clearly not what we want.
In fact, this points to a strategy for attacking the Community Notes algorithm. An attacker trying to break Community Notes using a lot of sockpuppet accounts won’t succeed just by upvoting notes that support some political agenda. As explained in the last post, the intercept is not the average, downvotes will not shift the intercept for a post if the Matrix Factorization can “explain” these downvotes by the polarity factors of the users.
Instead, the attacker should downvote helpful posts and upvote unhelpful posts, regardless of politics. With enough sockpuppet accounts, the result will be that the primary factor that explains variation in users voting behavior will not be politics, but helpfulness. The matrix factorization algorithm will thus discover this factor, and a regression for a helpful post will now look something like this:
       Vote
        +1   ✕ ✕ ✕ ✕
         |    ↗
         |  ↗
-1 ______|↗______ +1  User Helpfulness
        ↗|
      ↗  |
    ↗    |
  ✕ ✕   -1
The algorithm doesn’t know that the latent factor it has discovered corresponds to user helpfulness. It assumes that it corresponds to polarity. The result would be disastrous, because the algorithm will nullify the effect of Helpfulness and favor posts would be most upvoted if helpfulness were not a factor. And which posts might these be? Well in Community Notes, the factor that most predicts how users vote, after helpfulness, is…political bias! This is definitely not the desired result.
Two-Dimensional Matrix Factorization
Towards a possible solution to this problem, I have developed a variation of the algorithm that uses two dimensional Matrix factorization, and then uses a process similar to principal component analysis to find the high-entropy dimension and the low-entropy dimension.
Every user and post is characterized by a two-dimensional vector, instead of a single factor plus an intercept. So the estimated value of the user’s vote on a post is just the dot-product of this vector. That is, the model simplifies to:
$$ ŷ_{ij} = \vec{w_i} \cdot \vec{x_j} $$
Now, the two factors of this two-dimensional vector do not necessarily align with the polarity-factor and the common-ground factor: instead they may be any arbitrarily linear combination of these factors. So the results of the matrix factorization algorithm, when plotted in two dimensions, will appear to be rotated arbitrarily.
However, we can use a technique similar to principle component analysis to find a change of basis so that our axis align with the polarity and common-ground factor.
The chart below shows the results of this algorithm using a synthetic dataset. I created this dataset based on four user profiles: each profile is either left- or right-wing biased, but some users are “thugs” who only care about politics and not helpfulness, while other users make a good-faith effort to rate posts based on helpfulness.
I then created upvote/downvote Matrix with votes drawn randomly with probabilities defined by these profiles. I then factorized the resulting matrix using two latent factors. The results of the initial Matrix factorization are shown in the first row of charts below.
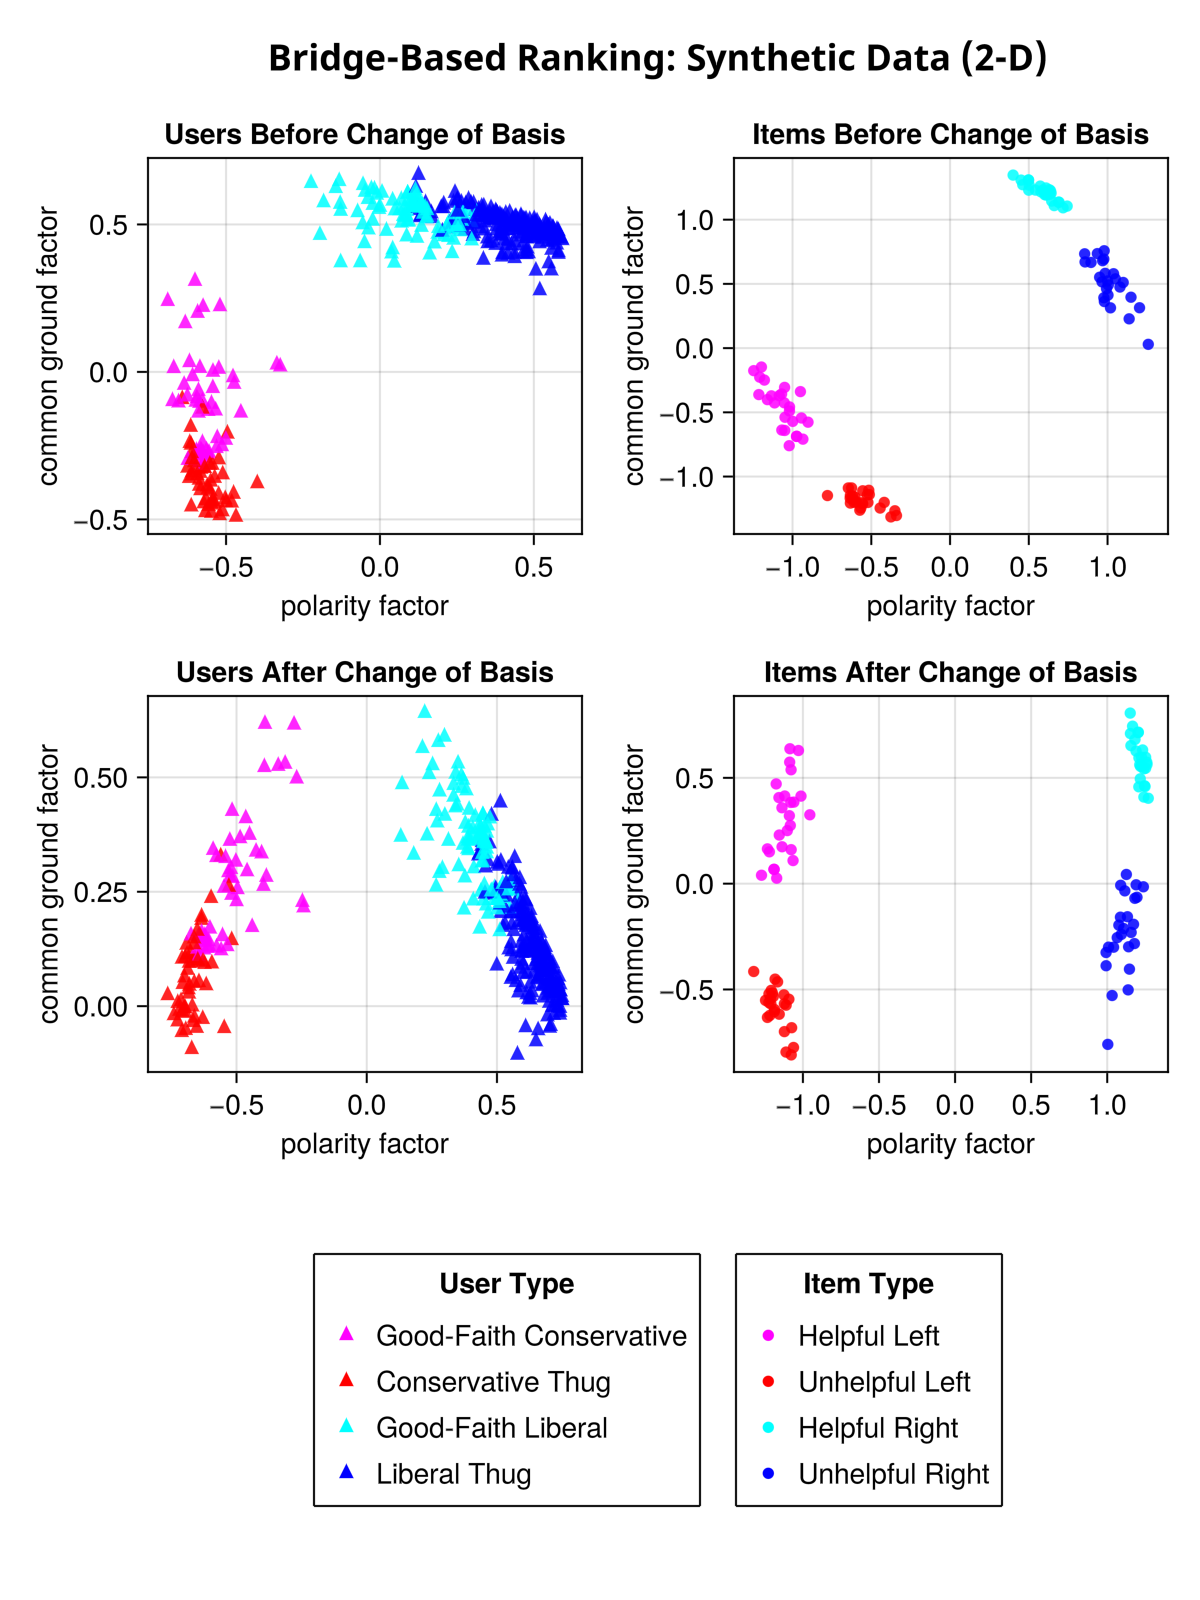
As you can see, the matrix factorization clearly has discovered the two dimensions that best explain the variation in users’ votes: left-right polarity and helpfulness. But it chose, in a sense, an arbitrary set of axes.
The bottom row of charts shows the same data after a change of basis that makes “polarity” the vertical axis and “common ground” the horizontal axis.
The key to discovering the polarity axis and the common-ground axis is to notice that there is less “disagreement” along the common-ground axis. As you can see in the bottom-left chart, almost all users have a positive value for the common-ground factor. If users were to vote entirely based on this factor, there would be little disagreement: they would mostly upvote helpful items and download unhelpful items.
So finding the common-ground axis is as simple as finding a vector which, when users are projected onto this vector, results in most users having a positive (or negative) value. The specific measure I use is actually a measure of entropy, which is the log of the probability that a user upvotes a post after users are projected into a vector. The exact code is here.
Likewise, the polarity axis can be discovered by finding the vector with maximum entropy.
The algorithm is almost identical to principal component analysis, except instead of maximizing variance, we maximize/minimize entropy.
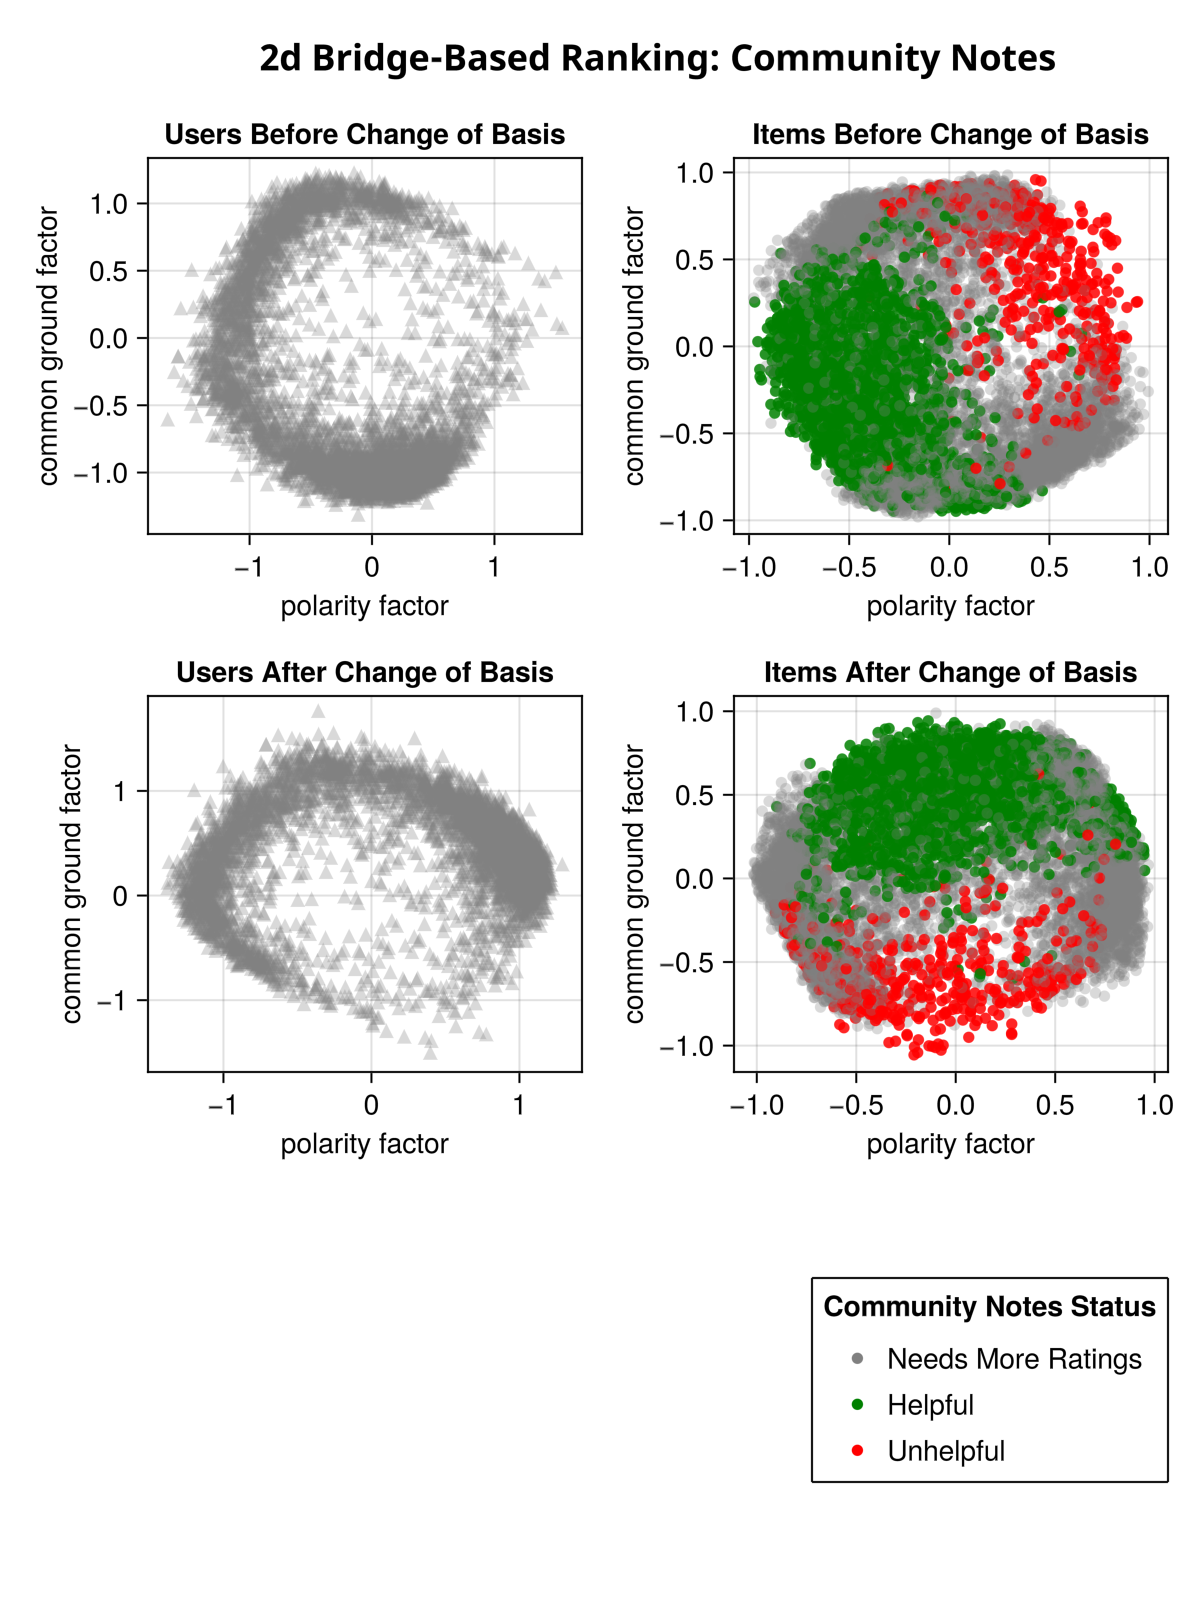
Here is a subset of the Community Notes data run through the same algorithm. As you can see, after initially running matrix factorization we don’t know which way is “up”. But after discovering the high-entropy and low-entropy vectors and doing a change of basis, the vertical does indeed correspond to “common ground”, as you see from the fact that the posts that Community Notes has rated as helpful (the green dots) mostly have a positive value for the common ground factor, and the red dots mostly have a negative value.
3D And Higher-Dimensional Matrix Factorization
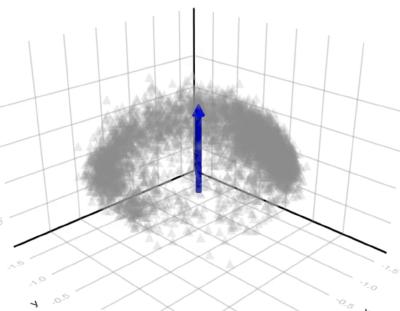
What happens if we go higher than 2 dimensions? When we do this, we find that users are actually highly polarized along two dimensions, but that there is still a third “common ground” dimension with lower entropy.
The graph of users in three dimensions looks like a hollow hemisphere, with the top of the hemisphere “pointing” in the direction of lowest entropy (common ground). Users along the of the hemisphere have low values for the common ground dimension, and high values for some linear combination of the two polarity dimensions. The bottom of the hemisphere is open/hollow because users that have a low value for the polarity factors have a high value for the common-ground factor. The more polarized users get along some dimensions, the lower their common ground factor tends to become, and the closer they approach one of the points on the rim.
The blue arrow points in the direction of “common ground”.
3d Matrix Factorization Chart
There is some point on the rim that corresponds to “left wing” and another that corresponds to “right wing” – probably the two clumps we can see. Perpendicular to this is the other polarization factor. I don’t know what this corresponds to in the real world, but I hope at some point to investigate further, perhaps feeding examples of notes that have high/low values along this dimension to an AI and asking it to come up with a word describing the two groups.
Comparing 1D, 2D, and 3D models
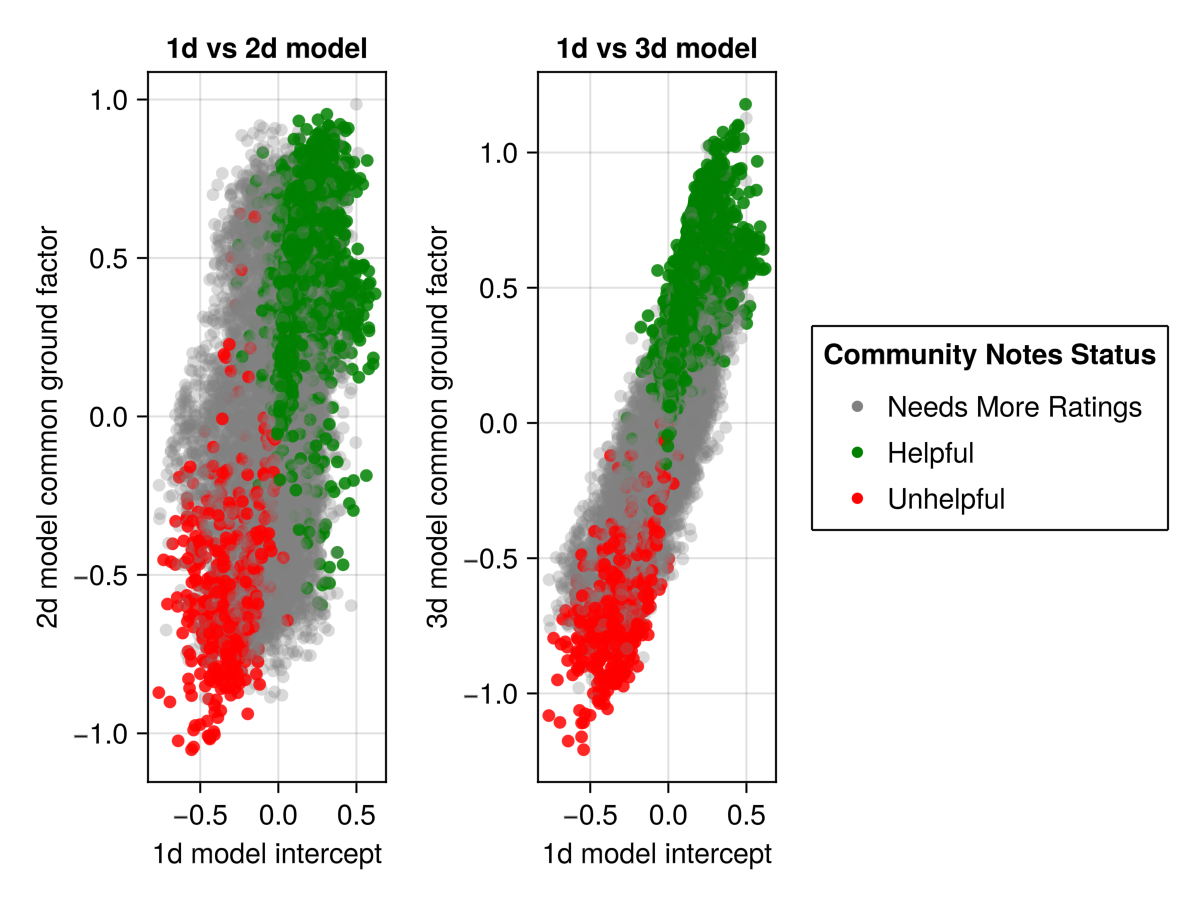
Theoretically the 1D model (using intercepts), and the 2D and 3D should produce similar results. The following chart graphs the common ground factors of the 2D and 3D models against the common-ground factor (the intercept) of the 1D model. As you can see, moving from 2 to 3 dimensions actually produces results closer to the original 1D model. The intercept in the 1D model does a good job of capturing all variation that can’t be explained by polarity.
1D vs 2D and 3D Models
What’s the Point?
Going back to the reason for straying from the original model using a single dimension and an intercept, the problem is that this model identifies the dimension with the highest variance, which may not be the dimension with the highest entropy – for instance, if the variance is due to expertise and not polarization.
Using the dimension with the lowest entropy, instead of the intercept, may be a more robust way of measuring common ground..
Another advantage to using two-dimension Matrix factorization is that it actually gives us a helpfulness factor for each user. The 1D model assigns an intercept to each user. This intercept can be thought of as the user’s “friendliness” – how likely they are to upvote a post ignoring that post’s polarity. But this intercept does not correspond to a user’s helpfulness.
With multi-dimensional matrix factorization, we get both a polarity factor and a helpfulness factor for each user. One of the advantages of characterizing users by helpfulness, and not just polarity, is that it can help with the cold-start problem. If a new post has only received a few votes, then we can estimate what it’s helpfulness factor by taking an average of the user’s votes weighted by their helpfulness factor.
Another thing I envision doing with a multi-model is automatic community “splitting” in a social network. A polarized community would use a bridgeing-based ranking algorithm but then the system could automatically create two subcommunities based on the polarization factors (e.g. “cats” and “dogs”). The original pet-pics community would be the “bridge” community, and the scores of posts in this community would be a projection of posts onto the common-ground vector. Then the sub-communities would be ranked by projecting posts onto vectors pointing to the left and right (and a little bit up). So dog-lovers could drill into the dog subcommunity to see posts that have a high raw-cuteness factor and a high dog factor.
There is a lot more to explore here. The algorithm is still susceptible to the problems such brigading, but this might be addressable using a technique similar to the technique used in pairwise quadratic funding as proposed in Vitalik Buterin’s article on community notes.
Yet another problem is the problem of information cascades and honesty. Users may learn to that they can increase their reputation/weight by upvoting posts that other people find helpful, even if they do not. But there may be a way of integrating some of the game-theoretical techniques for inducing honesty as described in my essay on Truthtelling Games.